PVA Graphs Lab
Partners: Mary Schaude and Hunter McCabe
Date: 3/17/14 - 4/1/14
Date: 3/17/14 - 4/1/14
Purpose
In this lab, we hope to determine the relationship between the graphs of motion and the equations that describe them.
Theory
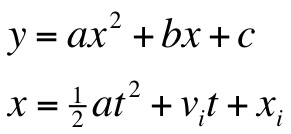
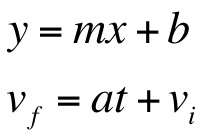
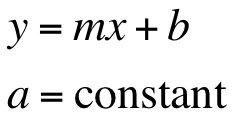
Kinematic equations show state the motion of something that is accelerating at a constant rate. There are four equations that we use. They are:

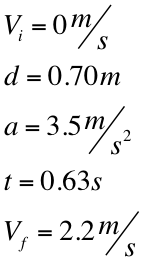
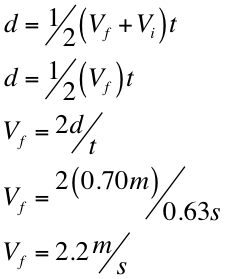
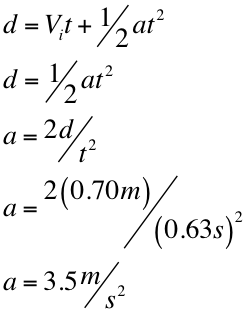
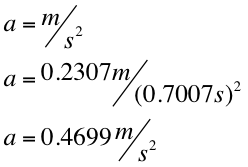
They can be used to find distance (d), time (t), acceleration (a), initial velocity (Vi), and final velocity (Vf). These equations can be manipulated to find any variable in the equation. The first one is used to find final velocity but can be used to find initial velocity, time, or acceleration. The second one is used to find distance, final and initial velocity, and time. The third kinematic equation is also used to find distance, initial velocity, and time. It can also find acceleration but not final velocity. The final equation is used to find final and initial velocity, acceleration, and distance. The first equation cannot be used to find distance. Equation number two does not include acceleration so that cannot be calculated. Final velocity cannot be calculated using the third kinematic equation. Finally, the fourth equation cannot find time.
A person can decide which equation to use based on the information given. The equations also correlate to graphs of position versus time, velocity versus time, and acceleration versus time. In a position versus time graph, the slope of the line is equivalent to the velocity of an object and the area underneath the line is the total displacement of the object. With a velocity versus time graph, the slope is the acceleration and the area underneath it is also displacement. Lastly in an acceleration versus time graph, the slope is the change of acceleration over a period of time (or jerk) and the area underneath shows the change in velocity.
A person can decide which equation to use based on the information given. The equations also correlate to graphs of position versus time, velocity versus time, and acceleration versus time. In a position versus time graph, the slope of the line is equivalent to the velocity of an object and the area underneath the line is the total displacement of the object. With a velocity versus time graph, the slope is the acceleration and the area underneath it is also displacement. Lastly in an acceleration versus time graph, the slope is the change of acceleration over a period of time (or jerk) and the area underneath shows the change in velocity.
Experimental Technique
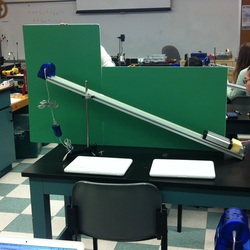
Apparatus:
-cart
-incline plane
-stand
-clamps
-memory foam
-motion sensor
-laptops
-masking tape
-Microsoft Excel
-DataStudio
-PhotoBooth
Procedure:
Step 1.) Connect the stand to the incline plane
Step 2.) Put the plane to the angle of 22 degrees
Step 3.) Position the memory foam stopping block on the downward end of the plane
Step 4.) Put the motion sensor on the upward end of the plane
Step 5.) Get the laptops running one is for recording the run on the motion sensor and the other is to film the run to check the time frame by frame
Step 6.) Put the tape on the plane 70cm apart as a distance interval for the run
Step 8.) Position the laptops to prepare for the experiment
Step 9.) Put the cart on the plane in the starting position
Step 10.) Start the video to record the run
Step 11.) Start the motion sensor
Step 12.) Release cart
Step 13.) Record data in Microsoft Excel
Step 14.) Solve for velocity and acceleration in Microsoft Excel
Step 15.) Solve the kinematic equations
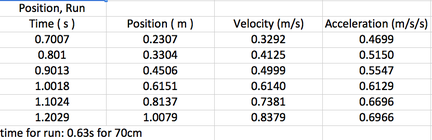
Data
|
|
Analysis
|
|
|
|
Conclusion
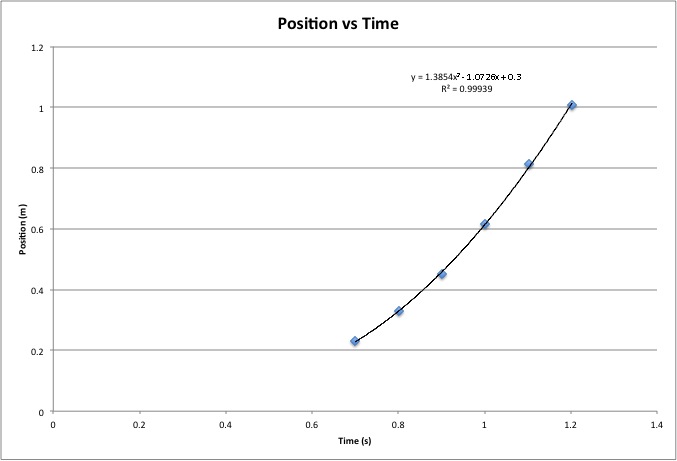
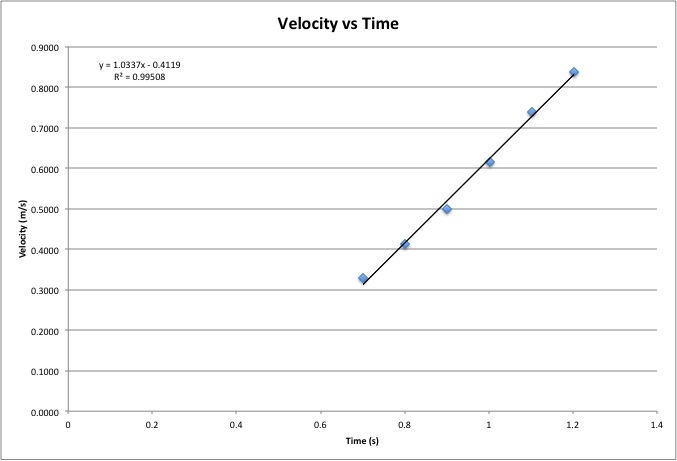
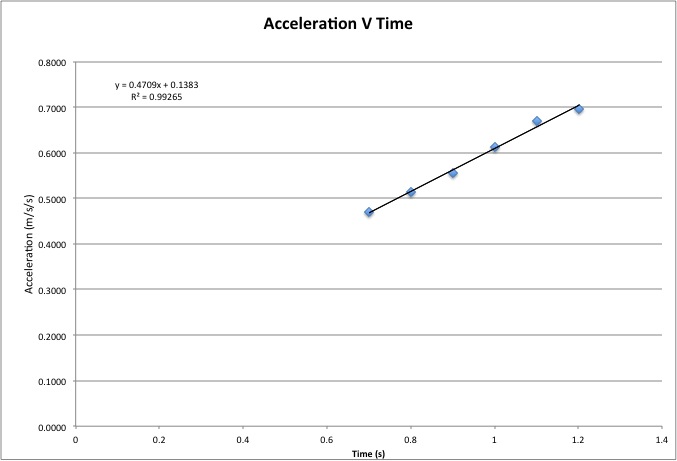
The reason for this lab was to find out how the kinematic equations relate to graphs. The kinematic equation for a position versus time graph would create a line parabolic in nature whereas on a velocity versus time graph it is linear. The correlation coefficient for these graphs were 0.99939 for the position versus time graph and 0.99508 for the velocity versus time graph. While the acceleration should be constant, the acceleration versus time graph shows that it is not. Since the graph is based off the velocity of the previous graph, the change in acceleration could be due to the change in velocity. Velocity and acceleration are independent from each making the acceleration versus time graph only useful for finding acceleration as a specific time. The correlation coefficient was 0.99265.
References
McCabe, H. K. (Photographer). (2014, March 19). PVA Set Up [Web Photo].
All other pictures courtesy of Microsoft Excel and Microsoft Word Equation Editor
All other pictures courtesy of Microsoft Excel and Microsoft Word Equation Editor
